More results...
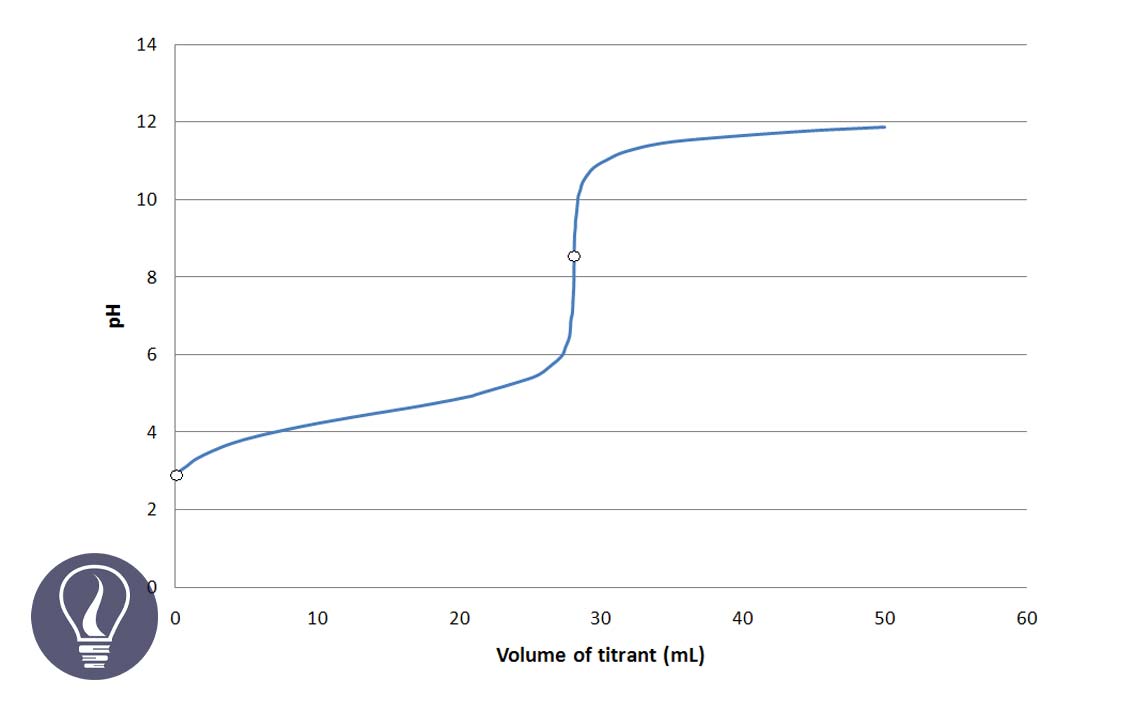

The titration curve represents the pH variation of a titration. Generally, acid-base titration curves are plotted pH of the analyte solution vs the volume of the titrant added.
In complexometric titrations, the titration curve is plotted pM vs the volume of the titrant added where M is the concentration of the metal ion.

We can clearly identify three regions of an EDTA titration curve (or any other titration curve)
The equivalence point of a titration is the point where all the analyte mols present in the solution have reacted with the titrant. In EDTA titration, the equivalence point is where all the metal ions have complexed with EDTA. At this point, the mols of added EDTA are equal to the mols of metal ions present in the solution.
When EDTA is added to the solution, EDTA starts to complex with the metal ions. In this region, there is an excess of metal ions. Therefore, the pM value is very low. (pM= -log[Mn+]). Added EDTA is not sufficient to complex with all metal ions present in the solution. In this region even if some amount of the complex has formed, the dissociation of the complex is negligible.
In this region, there is an excess of EDTA. After the equivalence point is passed, we consider that all the metal ions have reacted with EDTA. The concentration of the complex is high. Thus, we can consider that the solution is made out by dissolving the complex. There are some free metal ions from the dissociation of the complex.
Let’s consider that we are going to titrate 50 ml of 0.04 M Ca2+ solution with 0.08 M EDTA buffered to pH = 10. The titration curve is plotted p[Ca2+] value vs the volume of EDTA added. Therefore, we should calculate the p[Ca2+] value for each addition of EDTA volume.
First, let’s consider the addition of 5 ml of EDTA.

Since EDTA and Ca2+ ions are reacting 1:1 stoichiometric ratio, the reacted mols of Ca2+ ions are equal to the mols of EDTA present in the 5 ml.

At this point the Ca2+ concentration that comes from the dissociation of the [Ca - EDTA] complex is negligible.
At the equivalence point, we consider that all the Ca2+ ions form complexes with EDTA. Added mols of EDTA are perfectly sufficient to react with all the Ca2+ ions present in the solution.

Since all the Ca2+ ions have reacted with EDTA at the equivalence point, the mols of the formed complex are equal to the total mols of Ca2+ ions.

The formed complex again dissociates to Ca2+ ions and frees EDTA at the equilibrium. So, we can summarize the concentration of each component as follows.
| Ca2+ | EDTA | CaY2- | |
| Initial concentration | - | - | 0.0267 |
| Equilibrium concentration | x | x | 0.0267 - x |
Using the conditional formation constant expression for the above equilibrium at pH = 10, we can find the concentration of Ca2+ ions at the equivalent point.

When compared to 0.0267, x is too small and can be neglected. Therefore, we can write the above expression as follows.

After the equivalence point, there is an excess of EDTA. We also consider that all the Ca2+ ions have complexed with EDTA. The concentration of Ca2+ ions is given by the dissociation of the complex. Let’s consider adding 26 ml of EDTA to the solution.
We need 25 ml of EDTA to complex with all the Ca2+ ions in the sample. Adding 26 ml of EDTA means that there is 1 ml of excess EDTA.

Since the EDTA concentration given by the dissociation of the complex is too small, we take excess EDTA concentration as the total free EDTA concentration.

To get the correct concentration of the complex, the dissociated concentration should be subtracted from the above concentration. But when compared to the above value, the dissociated concentration is negligible. Therefore, we take the above concentration as the final concentration of the complex.

Above calculated values can be summarized as follows.
| The volume of EDTA (mL) | pCa2+ | |
| Before equilibrium point | 5.00 | 1.54 |
| At the equilibrium point | 25.00 | 5.85 |
| After the equilibrium point | 26.00 | 8.73 |
According to the above manner, we can calculate pCa2+ values for different volumes of EDTA. Then the titration curve is plotted using “Volume of EDTA” as the independent variable (x-axis) and “pCa2+” as the dependent variable (y-axis). The above values are calculated at pH = 10.

Harris, D.C. (1991) Quantitative Chemical Analysis. New York: Freeman.
The cover image was designed using an image by Quantumkinetics, licensed under CC BY 3.0, via Wikimedia Commons