More results...
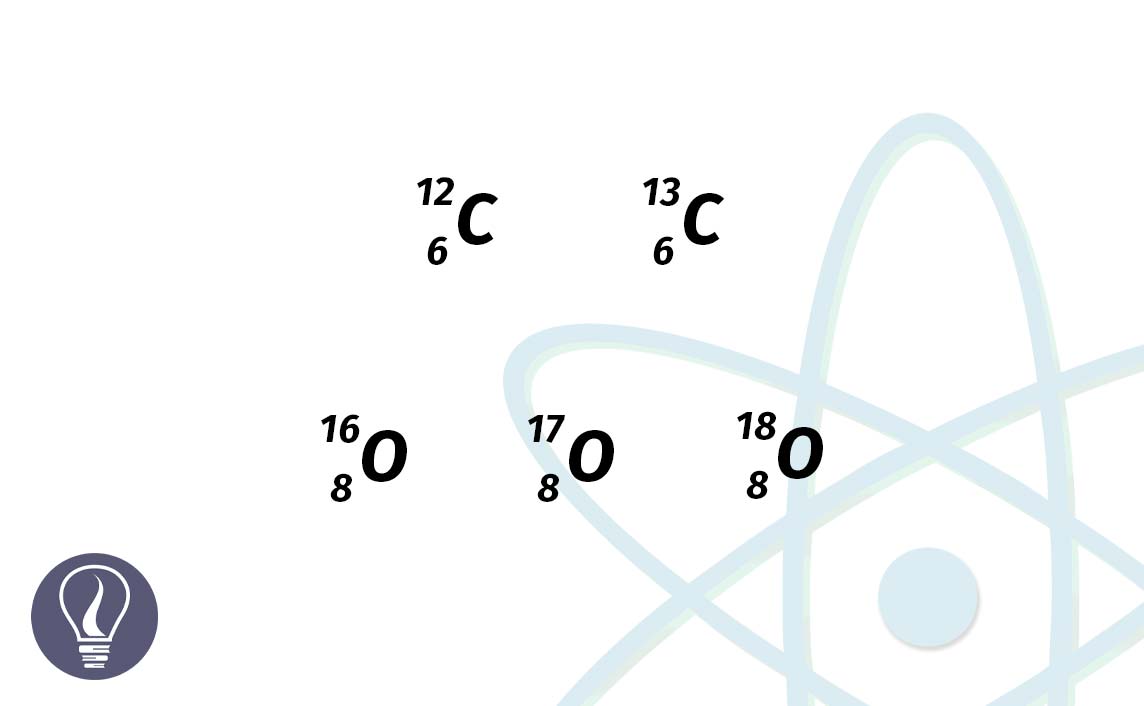

Nuclides of the same element that have the same amount of protons (atomic number) and electrons could have different mass numbers. This is due to the different number of neutrons present in the nucleus.
An element is defined using the number of electrons and protons an atom has. But in some elements, there are naturally occurring or artificially produced variants that have different numbers of neutrons.
Isotopes can be defined as the nuclides of a particular element that have different mass numbers. Isotopes can be naturally occurring nuclides or artificially produced nuclides.
An element that occurs naturally with only one variant of a nuclide is known as ‘monotopic’. In the periodic table, there are only 21 monotopic (pure) elements.
Monotopic elements:
9Be, 19F, 23Na, 27Al, 31P, 45Sc, 55Mn, 59Co, 75As, 89Y, 93Nb, 103Rh, 127I, 133Cs, 141Pr, 159Tb, 165Ho, 169Tm, 197Au, 209Bi, 232Th
While some elements exist as monotopic, some elements exist as a mixture of isotopes.
Because the atomic mass of an element is a constant, isotopes are often distinguished by stating only the mass number.
In general, isotopes of an element have the same chemical properties. However, because of the mass difference between isotopes, they have different physical properties.
There are stable isotopes and unstable radioactive isotopes. Sometimes some isotopes of of elements make the nucleus of the atom unstable and they are subject to spontaneous decay into different isotopes or elements by emitting radiation. Those isotopes radioactive isotopes are called 'radioisotopes'.
Radioisotopes are rare in nature because they have been subjected to billions of years of spontaneous decay. We will discuss more about radioactivity and radioisotopes in a separate article.
Naturally, all of the isotopes of an element do not exist in similar amounts. This is caused by many reasons such as the origin of the element, the stability of the nucleus, etc.
The natural abundance of an isotope is basically the amount of that particular isotope that exists naturally in the mixture of nuclides of that element. Percent natural abundance is the percentage of that.
When determining the relative atomic mass of an element that exists as a mixture of isotopes naturally, the percent natural abundance (distribution) of isotopes in the mixture and the atomic masses of each isotope have to be considered.
So the mean atomic mass of isotopes is the relative atomic mass of an element.
Let’s consider an element that has two isotopes.

Where,
Question 01
Lithium has two isotopes 6Li and 7Li. Abundances of those two isotopes are 7.42% and 92.58% respectively. Respectively, their exact masses are 6.0151 u and 7.0160 u. So, find the relative atomic mass of lithium.
Solution

Question 02
Boron has two isotopes, 10B and 11B. The exact masses are 10.0129 u and 11.0093 u respectively. The relative atomic mass of boron is 10.811 u. Calculate the abundance of each isotope and ratio of 10B:11B.
Solution
Let’s consider the abundance of 10B is ‘x’. So, the abundance of 11B will be ‘100 – x’.

*For solving these questions, we have used rounded-up values because we want to show the steps of solving the questions clearly to the readers. But if you use more accurate values as shown in Table 01, the answers would be slightly different.
| Element | Isotope | Accurate mass (u) | Abundance % |
| H (Hydrogen) | 1H | 1.007825 | 99.99 |
| 2H | 2.014102 | 0.015 | |
| 3H | 3.016049 | ~ 10-18 | |
| He (Helium) | 3He | 3.016029 | 0.0001 |
| 4He | 4.002603 | 100.00 | |
| Li (Lithium) | 6Li | 6.015123 | 7.42 |
| 7Li | 7.016005 | 92.58 | |
| B (Boron) | 10B | 10.012938 | 19.80 |
| 11B | 11.009305 | 80.20 | |
| C (Carbon) | 12C | 12.000000 | 98.90 |
| 13C | 13.003355 | 1.10 | |
| N (Nitrogen) | 14N | 14.003074 | 99.63 |
| 15N | 15.000109 | 0.37 | |
| O (Oxygen) | 16O | 15.994915 | 99.76 |
| 17O | 16.999131 | 0.038 | |
| 18O | 17.999159 | 0.20 | |
| Ne (Neon) | 20Ne | 19.992439 | 90.60 |
| 21Ne | 20.993845 | 0.26 | |
| 22Ne | 21.991384 | 9.20 | |
| Mg (Magnesium) | 24Mg | 23.985045 | 78.90 |
| 25Mg | 24.985839 | 10.00 | |
| 26Mg | 25.982595 | 11.10 | |
| Si (Silicon) | 28Si | 27.976928 | 92.23 |
| 29Si | 28.976496 | 4.67 | |
| 30Si | 29.973772 | 3.10 | |
| S (Sulfur) | 32S | 31.972072 | 95.02 |
| 33S | 32.971459 | 0.75 | |
| 34S | 33.967868 | 4.21 | |
| 36S | 35.967079 | 0.020 | |
| Cl (Chlorine) | 35Cl | 34.968853 | 75.77 |
| 37Cl | 36.965903 | 24.23 | |
| Ar (Argon) | 36Ar | 35.967546 | 0.34 |
| 38Ar | 37.962732 | 0.063 | |
| 40Ar | 39.962383 | 99.60 | |
| K (Potassium) | 39K | 38.963708 | 93.20 |
| 40K | 39.963999 | 0.012 | |
| 41K | 40.961825 | 6.73 | |
| Ca (Calcium) | 40Ca | 39.962591 | 96.95 |
| 42Ca | 41.958622 | 0.65 | |
| 43Ca | 42.958770 | 0.14 | |
| 44Ca | 43.955485 | 2.086 | |
| 46Ca | 45.953689 | 0.004 | |
| 48Ca | 47.952532 | 0.19 | |
| Ti (Titanium) | 46Ti | 45.952633 | 8.00 |
| 47Ti | 46.951765 | 7.30 | |
| 48Ti | 47.947947 | 73.80 | |
| 49Ti | 48.947871 | 5.50 | |
| 50Ti | 49.944786 | 5.40 | |
| U (Uranium) | 234U | 234.040947 | 0.006 |
| 235U | 235.0439925 | 0.72 | |
| 238U | 238.050786 | 99.27 |

To separate isotopes and measure their distribution ‘Mass spectrometry’ is used.
Mass spectrometry can separate atoms and molecules based on their mass-to-charge ratio. (m/z). Because of the different mass numbers of isotopes, the spectrometer will be able to separate and quantify them.
In a mass spectrum of an element, each isotope is represented in a peak the intensity of that peak is proportional to the relative abundance of that isotope. The peak that has the highest intensity corresponds to the isotope that has the highest relative natural abundance.
The mass spectrum in Figure 02 shows the isotopic distribution of naturally occurring titanium. In that spectrum, it can be seen the different abundance of each isotope.


Housecroft, C.E. and Sharpe, A.G. (2018) Inorganic Chemistry. Harlow: Pearson Education.
Data shown in Table 01 was extracted from Scientific Instrument Services (SIS) - Exact Masses of the Elements and Isotopic Abundances
The cover image was created using an image by Dede from Pixabay
Figure 01: Contains an image by 2012rc, licensed under CC BY 3.0, via Wikimedia Commons