More results...

X-Ray Powder Diffraction (XRPD), also known as Powder X-ray Diffraction (PXRD), is a powerful and widely used X-ray diffraction technique for characterizing crystalline materials. While the first article covered the fundamental physics of how X-rays interact with crystals, this article focuses on the practical application of that theory to analyze polycrystalline, or “powder,” samples.
XRPD can provide valuable information about a material, including its phase composition, unit cell parameters, crystallite size, and microstrain.
The key to XRPD lies in the nature of the sample itself. Unlike a single crystal, a powder sample is composed of thousands or millions of tiny crystallites (grains), each acting as a miniature crystal. Importantly, these crystallites are randomly oriented.
This random orientation is crucial. For any given set of atomic planes with spacing d, the large number of crystallites ensures that some will be oriented at the exact angle θ required to satisfy Bragg’s Law. A single crystal, by contrast, must be precisely rotated to find the correct orientation for each set of planes.
Because of this random orientation, the diffracted X-rays form a series of cones known as Debye cones, each corresponding to a specific set of atomic planes.
 1")
The analysis is performed using an instrument called a powder diffractometer. While designs can vary, they all share several essential components. A common and widely used configuration is the Bragg–Brentano geometry.
 2")
 3")
In a typical XRPD measurement, the X-ray tube is fixed, while the goniometer rotates the sample holder by an angle θ and simultaneously rotates the detector by 2θ. This synchronized movement ensures that the detector always records the diffracted beam corresponding to the atomic planes that satisfy Bragg’s condition.
When the incident X-ray beam strikes the atomic planes in the crystal, each plane reflects X-rays at an angle equal to the incident angle. Constructive interference—and therefore a diffraction peak—occurs only when Bragg’s Law is satisfied.
A single crystal would produce only one family of diffraction peaks at specific orientations. In contrast, a polycrystalline (powder) sample contains a vast number of crystallites in random orientations, so all possible diffraction peaks are generated simultaneously.
If the powder has sufficient crystallites with random orientations, the diffracted beams form continuous Debye–Scherrer cones. The intersection of these cones with the detector surface produces a series of diffraction rings, which are recorded as peaks in the diffractogram.
 5")
Amorphous materials and crystallites smaller than about 120 nm cause noticeable broadening of the diffraction peaks because of limited long-range order and size effects.
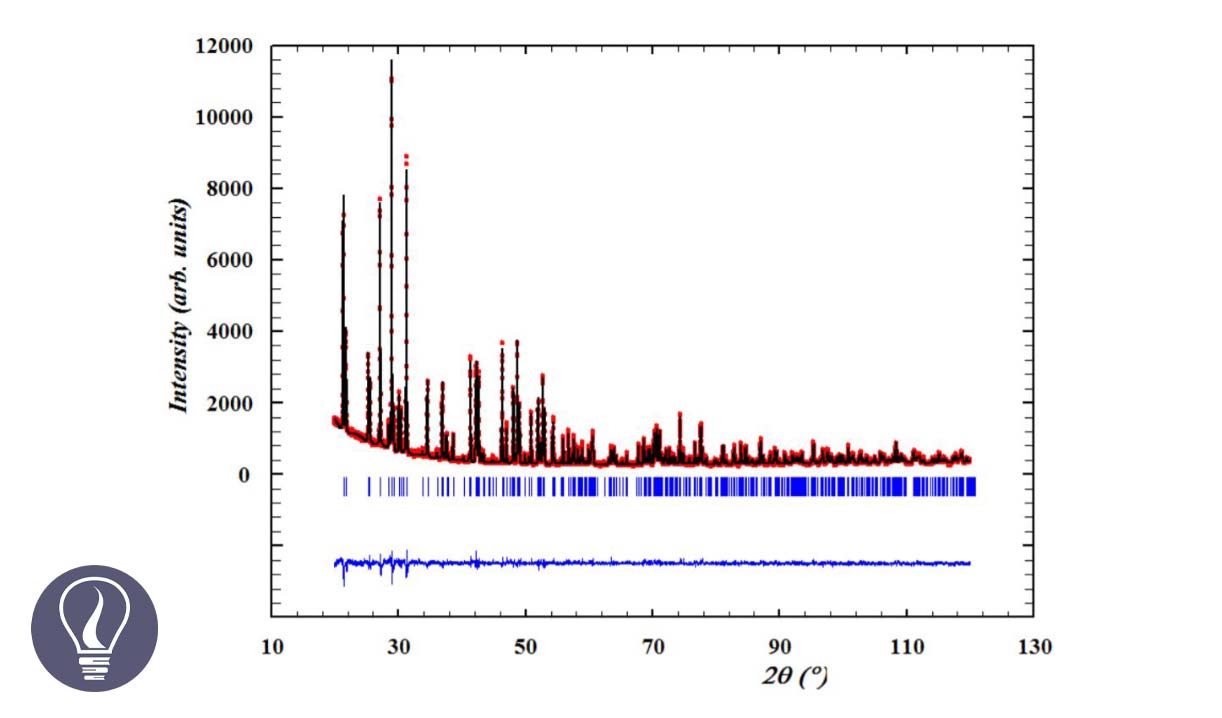
The output of an XRPD experiment is a diffractogram, which plots the intensity of diffracted X-rays as a function of the detector angle (2θ).
By comparing the measured diffractogram with reference data from a database (such as the ICDD Powder Diffraction File), one can identify the crystalline phases present in the sample.
 6")
The appearance of a diffraction pattern can reveal additional information:
X-ray Powder Diffraction (XRPD) is a cornerstone technique in materials characterization. Analyzing the positions and intensities of diffraction peaks from a polycrystalline sample provides crucial insights into phase composition, crystal structure, and microstructural features such as size and strain.

Vickerman, J. C.; Gilmore, I. S. Surface analysis – the principal techniques; 2009. https://doi.org/10.1002/9780470721582.
The cover image was designed using an image by K E Wright, K Popa, and P Pöml, licensed under CC BY 3.0, via Wikimedia Commons
Figure 02: An illustration by DrBoStefanov, licensed under CC BY-SA 4.0, via Wikimedia Commons
Figure 03: An image by Sufangxi, licensed under CC BY-SA 4.0, via Wikimedia Commons
Figure 06: An image by K E Wright, K Popa, and P Pöml, licensed under CC BY 3.0, via Wikimedia Commons