More results...

pH is a scale that is used to express the H+ ion concentration in aqueous solutions. At the standard temperature (25 °C), the pH scale ranges from 0 to 14. In acid-base titrations, the pH of the solution changes when the titration proceeds. pH titration curves are plotted by the variation of pH value with respect to the volume of the titrant. pH curves are important for determining the equivalence point of a titration, predicting a suitable indicator for the titration, and identifying the strength of the acid and the base.
In a titration, the equivalence point is where all the analyte moles have completely reacted with the titrant. The volume of the titrant added is taken as the equivalence point value. Practically, to find the equivalence point in titration is nearly impossible. Because in a titration, we can only observe the point where the color change occurs. At this point, the titration is stopped, and the titrant volume is taken as the endpoint. The point where the color change occurs is known as the endpoint.
To get a better result, the equivalent point and the end point should be very close to each other. Therefore, the color change must occur at the equivalence point. For this to happen, the pH at the equivalence point must be within the pH range of the indicator. Also, some human errors can affect the endpoint of a titration.
There are three types of acid-base titrations
Weak acid and weak base titrations are not carried out because it does not show a rapid pH depletion at the equivalence point.
This article mainly focuses on Strong acid–strong base titration. Other types of titrations will be discussed in separate articles.
Strong acids are acids that will completely dissociate into their ions in an aqueous medium and release H+ ions to the solution. In a dilute strong acid solution, the acid can only be found as H+ ions and the respective anion form. There is no molecular form of the strong acid in a dilute solution.
Also, strong bases are bases that will completely dissociate into their ions in an aqueous medium and release OH- ions to the solution. In a dilute strong base solution, the base can only be found as OH- ions and the respective cation form. There is no molecular form of the strong base in a dilute solution.
An acid-base reaction results in the respective salt and H2O. The salt that is formed by a strong acid-strong base titration is neutral.
Let’s take an instance where an amount of 25 cm³ of 0.1 moldm-3 NaOH solution is titrated with 0.1 moldm-3 HCl solution. NaOH solution is taken to the titration flask, and the HCl is added to the burette. The titration is carried out at 25 °C. In this titration, the following reaction occurs.

Let’s find out the change in pH of the solution with respect to the volume added of NaOH. Then the pH titration curve is plotted between the pH vs the Volume added of NaOH.
Question 01. What is the initial pH of the solution?
Initially, there is only a dilute solution of NaOH in the titration flask. NaOH has been dissociated into Na+ ions and OH- ions. Since NaOH has been completely dissociated, the OH- concentration is equal to the initial concentration of NaOH.

In this calculation, the OH- ion concentration comes from the dissociation of water, has been neglected.
Question 02: Find the pH of the solution when 5 cm³ of HCl is added.
Since the NaOH and HCl are equal in concentration and the stoichiometric ratio between HCl and NaOH is 1:1,


In this calculation, the OH- ion concentration comes from the dissociation of water, has been neglected.
Question 03: Find the pH of the solution when 10 cm³ of HCl is added to the solution.
Since the NaOH and HCl are equal in concentration and the stoichiometric ratio between HCl and NaOH is 1:1,


In this calculation, the OH- ion concentration, which comes from the dissociation of water, has been neglected.
Question 04: Find the pH of the solution when 20 cm³ of HCl is added to the solution.
Since the NaOH and HCl are equal in concentration and the stoichiometric ratio between HCl and NaOH is 1:1,


In this calculation, the OH- ion concentration, which comes from the dissociation of water, has been neglected.
Question 05: Find the pH of the solution when 24.9 cm³ of HCl is added to the solution.
Since the NaOH and HCl are equal in concentration and the stoichiometric ratio between HCl and NaOH is 1:1,


In this calculation, the OH- ion concentration comes from the dissociation of water, has been neglected.
Question 06: Find the pH of the solution when 25 cm³ of HCl is added to the solution.
Since the NaOH and HCl are equal in concentration at this point, all the NaOH molecules in the solution will completely react with the HCl to form NaCl and H2O. Therefore, this is the equivalent point of the reaction. At this point, there is no excess acid or base. The pH of the solution is given by the dissociation of water.


At the equivalent point, the pH of the solution is 7. That means the solution is neutral. In strong acid-strong base titrations, a neutral equivalent point is obtained.
Question 07: Find the pH of the solution when 25.1 cm³ of HCl is added to the solution
After the equivalent point, the base has been completely reacted with the acid. If 25.1 cm³ of HCl is added to the solution, there is are excess of acid in the solution. Therefore, the pH of the solution is given by the excess acid in the solution.

After the equivalent point, even a small addition of the acid makes a significant change in pH. At the equivalent point, the pH was 7. After the addition of 0.1 cm³ of HCl, the pH of the solution has dramatically changed to pH = 3.7.
Question 08: Find the pH of the solution when 30 cm³ of HCl is added to the solution
Since the NaOH and HCl are equal in concentration and the stoichiometric ratio between HCl and NaOH is 1:1,

Question 09: Find the pH of the solution when 50 cm³ of HCl is added to the solution
Since the NaOH and HCl are equal in concentration and the stoichiometric ratio between HCl and NaOH is 1:1,

Let’s tabulate the added HCl volume and the obtained pH values in the above calculations.
| HCl volume (cm3) | pH |
| 0 | 13 |
| 5.0 | 12.83 |
| 10.0 | 12.63 |
| 20.0 | 12.05 |
| 24.9 | 10.3 |
| 25.0 | 7 |
| 25.1 | 3.70 |
| 30.0 | 2.04 |
| 50.013 | 1.48 |

You can use the Interactive Titration Curve Simulator by Learnbin Lab to create pH titration curves
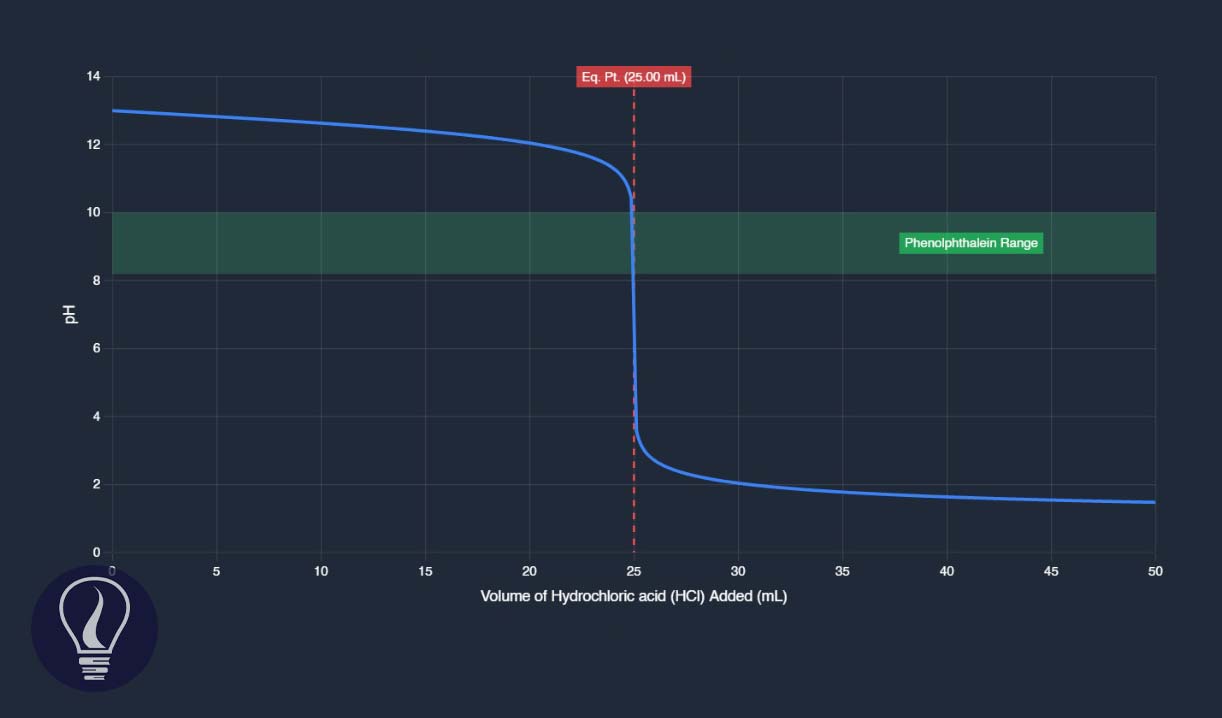
The above pH titration curve shows a sharp pH depletion (pH = 10.3 to 3.7) between the HCl volumes = 24.0 cm3 and 25.1 cm3. Practically, this difference is very small. This volume change is roughly equal to the two drops of the burette. The equivalent point is between this small volume change.
In a titration, an indicator is used to find the equivalence point. To find the equivalent point, the color change of the indicator must occur within the phase where there is a sharp pH depletion in the titration curve. According to the above example, the sharp pH depletion occurs within the range of pH = 10.3 and 3.7. For this kind of titration, it is suitable to use an indicator that has a pH within this range.
Phenolphthalein, which has a pH around 8.3, can be used as an indicator for the above titration. It will show the color change (pink to colorless) at pH = 8.3. When the color change occurs, the titration is stopped, and the burette reading is taken as the endpoint value. The endpoint value is a very close value to the equivalent point.
But practically, it is nearly impossible to obtain the equivalent point as the end point. This can be affected by many reasons. Mainly, the color change occurs somewhere within the pH range of the titration curve, and it does not change the color at the equivalent point. Also, the personnel errors can occur. However, ± 0.1 error in the volume is acceptable. To minimize the personnel errors, usually the titration is carried out three times, and the average of the endpoints in each titration is taken as the endpoint value.

Harris, D. C.; Lucy, C. A. Quantitative Chemical Analysis, 9th ed.; W. H. Freeman & Company: New York, 2016.
The cover image and Figure 01 were created using an Interactive Titration Curve Simulator by Learnbin Lab